Languages
Profiling simulation runtimes in VCS
I am simulating a rather large system model with XMODEL, using Synopsys VCS as the host SystemVerilog simulator. To improve the current simulation runtime, I'd like to know which part of the model is consuming the most time. Is there a way to measure the time consumed by each module instance during the simulation?
Yes, there is. It's called "profiling". Most SystemVerilog simulators are equipped with a profiling capability and VCS is no exception. As one of the reports generated by profiling is the list of times consumed by the individual module instances, you can use this result to find any bottlenecks in your models.
To enable profiling, add the VCS-specific option '-simprofile' to the 'xmodel' command using the '--elab-option'. For more information on this '--elab-option', please refer to this Q&A posting. If you are using the VCS commands directly to run the simulation, you can add the '-simprofile' option to the command performing the elaboration.
xmodel <other options> --elab-option -simprofile --
Now, run the simulation. By default, the simulator creates result files named 'profileReport.txt' and 'profileReport.html'.
Below is an excerpt of the text file 'profileReport.txt'. One of its reports lists the percentage of the runtime consumed by each instance in the design hierarchy.
============================================================================================
                                     Time Instance View
============================================================================================
        Instance           %TotalTime     Module/Program  Source
                            incl|excl      /Architecture
--------------------------------------------------------------------------------------------
tb_run                     19.10|0.09             tb_run  /home/user/RFIC/tb_run.sv:14
tb_run.TB_TOP_5G           19.01|0.00          TB_TOP_5G  /home/user/RFIC/tb_run.sv:16
tb_run.TB_TOP_5G.BB_GEN     0.55|0.00         BB_GEN_TOP  /home/user/RFIC/TB_TOP_5G.sv:207
tb_run.TB_TOP_5G.BB_GEN.B   0.54|0.00         BB_GEN_ADC
B_GEN_ADC_HB                                              /home/user/RFIC/BB_GEN_TOP.sv:59
tb_run.TB_TOP_5G.RX_ABB    18.00|0.92             RX_ABB  /home/user/RFIC/TB_TOP_5G.sv:195
  ctrl_blk3(Port)           0.67|0.67                 --  /home/user/RFIC/RX_ABB.sv:20
tb_run.TB_TOP_5G.RX_ABB.R   0.50|0.00        RX_ABB_CORE  /home/user/RFIC/RX_ABB.sv:35
X_ABB_LB1
tb_run.TB_TOP_5G.RX_ABB.R   0.52|0.00        RX_ABB_CORE  /home/user/RFIC/RX_ABB.sv:37
X_ABB_MHB2
tb_run.TB_TOP_5G.RX_ABB.R   0.51|0.05    RX_ABB_CORE_PGA  /home/user/RFIC/RX_ABB_CORE.sv:33
X_ABB_MHB2.RX_ABB_PGA_Q
...
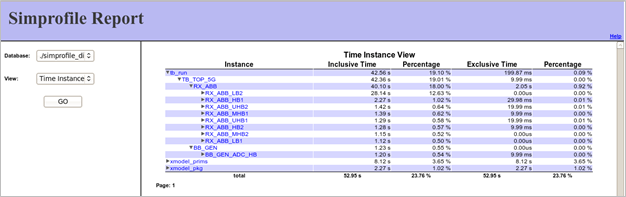
You can also view the profiling results with a web browser.
firefox ./profileReport.html
This HTML report provides an interactive way of browsing the profiling results. For more information on using the VCS profiler, please refer to the Synopsys documentations.
Note that this VCS profiler cannot provide detailed analysis for the parts described by the circuit primitives of XMODEL. On profiling the simulation times of your circuit-level models (CLMs), refer to an alternate method described by this Q&A posting.
Please refer to this Q&A posting if you'd like to learn how to profile your simulation running in NCVerilog/Xcelium.
Please login or Register to submit your answer
VCS에서 시뮬레이션 수행시간 프로파일링하는 방법
Synopsys VCS와 XMODEL을 사용해 비교적 크고 복잡한 시스템 모델을 시뮬레이션하고 있습니다. 현재 시뮬레이션 수행시간을 더 개선하기 위해서, 모델의 어떤 부분이 가장 많은 시간을 소모하고 있는지를 알고 싶습니다. 시뮬레이션 동안 각 모듈 인스턴스들이 소모하는 시간을 측정하는 방법이 있나요?
Yes, there is. It's called "profiling". Most SystemVerilog simulators are equipped with a profiling capability and VCS is no exception. As one of the reports generated by profiling is the list of times consumed by the individual module instances, you can use this result to find any bottlenecks in your models.
To enable profiling, add the VCS-specific option '-simprofile' to the 'xmodel' command using the '--elab-option'. For more information on this '--elab-option', please refer to this Q&A posting. If you are using the VCS commands directly to run the simulation, you can add the '-simprofile' option to the command performing the elaboration.
xmodel <other options> --elab-option -simprofile --
Now, run the simulation. By default, the simulator creates result files named 'profileReport.txt' and 'profileReport.html'.
Below is an excerpt of the text file 'profileReport.txt'. One of its reports lists the percentage of the runtime consumed by each instance in the design hierarchy.
============================================================================================
                                     Time Instance View
============================================================================================
        Instance           %TotalTime     Module/Program  Source
                            incl|excl      /Architecture
--------------------------------------------------------------------------------------------
tb_run                     19.10|0.09             tb_run  /home/user/RFIC/tb_run.sv:14
tb_run.TB_TOP_5G           19.01|0.00          TB_TOP_5G  /home/user/RFIC/tb_run.sv:16
tb_run.TB_TOP_5G.BB_GEN     0.55|0.00         BB_GEN_TOP  /home/user/RFIC/TB_TOP_5G.sv:207
tb_run.TB_TOP_5G.BB_GEN.B   0.54|0.00         BB_GEN_ADC
B_GEN_ADC_HB                                              /home/user/RFIC/BB_GEN_TOP.sv:59
tb_run.TB_TOP_5G.RX_ABB    18.00|0.92             RX_ABB  /home/user/RFIC/TB_TOP_5G.sv:195
  ctrl_blk3(Port)           0.67|0.67                 --  /home/user/RFIC/RX_ABB.sv:20
tb_run.TB_TOP_5G.RX_ABB.R   0.50|0.00        RX_ABB_CORE  /home/user/RFIC/RX_ABB.sv:35
X_ABB_LB1
tb_run.TB_TOP_5G.RX_ABB.R   0.52|0.00        RX_ABB_CORE  /home/user/RFIC/RX_ABB.sv:37
X_ABB_MHB2
tb_run.TB_TOP_5G.RX_ABB.R   0.51|0.05    RX_ABB_CORE_PGA  /home/user/RFIC/RX_ABB_CORE.sv:33
X_ABB_MHB2.RX_ABB_PGA_Q
...
You can also view the profiling results with a web browser.
firefox ./profileReport.html
This HTML report provides an interactive way of browsing the profiling results. For more information on using the VCS profiler, please refer to the Synopsys documentations.
Note that this VCS profiler cannot provide detailed analysis for the parts described by the circuit primitives of XMODEL. On profiling the simulation times of your circuit-level models (CLMs), refer to an alternate method described by this Q&A posting.
Please refer to this Q&A posting if you'd like to learn how to profile your simulation running in NCVerilog/Xcelium.
Please login or Register to submit your answer