xwave: Waveform Viewer
Overview
XWAVE Waveform Viewer offers an interactive graphical interface for users to view and examine the result waveforms after the simulation. XWAVE Waveform Viewer is tuned to displaying JEZ-format waveforms, which store the analog signal waveforms in event-based format. It offers fast rendering, yet accurate results with virtually unlimited resolution.
Basic Command
The minimal way of starting the XWAVE Waveform Viewer is just to type xwave on the command-line prompt:
unix> xwave
Then, the XWAVE Waveform Viewer will start, showing the main application window, and soon a Signal Browser window will pop-up asking you to select a waveform file (Figure 1).
To instruct XWAVE to load the waveform files in the command-line, simply provide the filenames as arguments. For instance:
unix> xwave xmodel.jez
In this case, the waveform file will be loaded as soon as the XWAVE Waveform Viewer is started.
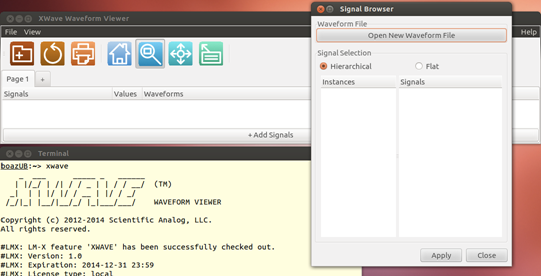
Figure 1. XWAVE started without any command-line options or arguments.
If you want to display all the signal waveforms stored in the file without having to select them individually later, simply pass an -a option at the command-line:
unix> xwave -a xmodel.jez
or
unix> xwave xmodel.jez -a
Then, the application will start by displaying all the signal waveforms in the file (Figure 2). The default behavior is that all the digital signals (e.g. xbit and bit-typed signals) are loaded into separate panes while all the analog signals (e.g. xreal and real-typed signals) loaded into a single, shared pane.
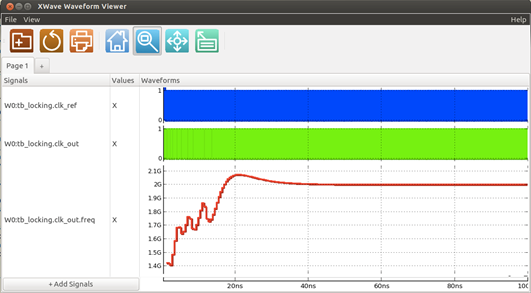
Figure 2. XWAVE started with the -a option to display all the signals stored in the waveform file.
Available Options
Typing a command xwave -h on the UNIX command-line prompt displays all the available options for the XWAVE Waveform Viewer.
unix> xwave -h
Usage: xwave [options] [< filename1>] [< filename2>] ...

XMODEL waveform viewer utility.

Options:
  -h, --help               show this help message and exit
  -a, --all                display all waveforms.
  -c FILENAME, --command=FILENAME
                           load a command file.
  -l, --list               display the list of variables.
  -v VARNAME1,VARNAME2,..., --vars=VARNAME1,VARNAME2,...
                           a comma-separated list of variables to be displayed.
  -b, --xbit, --bit        display all xbit/bit waveforms.
  -r, --xreal, --real      display all xreal/real waveforms.…
Descriptions on the selected options are as follow:
Signal selection options:
-aor--all: displays all signal waveforms stored in the input files.-b,--xbit, or--bit: displays all digital-type signals stored in the input files.-r,--xreal, or--real: displays all analog-type signals stored in the input files.-v VARNAME1,VARNAME2,…or--vars=VARNAME1,VARNAME2,…: displays the specified list of variables. The list should be comma-separated without any spaces.
Application-related options:
-h: displays the help messages.-lor--list: displays the list of variables contained in the input files.-cor--command: load a command script upon start-up.
Graphical User Interface
XWAVE Waveform Viewer is equipped with simple and intuitive graphical user interface. Most users will soon be acquainted with its usage after a few initial uses.
Opening and Reloading Waveform Files
The first two icons on the toolbar are for opening and reloading the waveform files, respectively. For instance, clicking the first icon, users can open a new waveform file. Clicking the second icon, reloads all the currently-opened waveform files and updates the waveforms displayed on the screen. This is a convenient command to reload the waveforms after the simulation results have been updated.
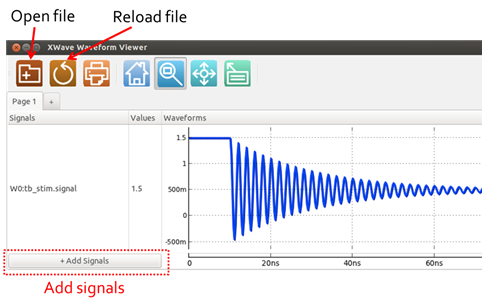
Figure 3. Menu icons for opening and reloading the waveform files
Adding New Signals to Display
To add a new signal to display after loading a waveform file, simply click the button that says “+Add Signals”. The button is located on the bottom of the application window as shown in Figure 4.
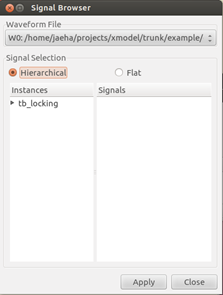
Figure 4. Add Signals button location when there are no signals displayed (top) and when there is a signal displayed (bottom).
Pressing the “+Add Signals” button pops up the Signal Browser dialog box. Use the interface to locate the signals you want to display and either double-click the signal’s name or press Apply button. You may select more than one signals at a time.
For user’s convenience, the signal names can be browsed in two modes: hierarchical and flat modes. In the hierarchical mode, one can traverse down the design hierarchy and select the signals that belong to a particular instance. On the other hand, in the flat mode, one can see all the signal names at once regardless of their hierarchical locations.
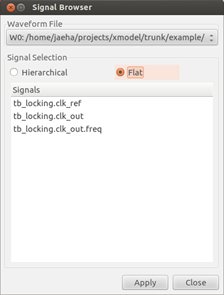
Figure 5. Signal Browser dialog in two modes: hierarchical view (left) and flat view (right).
Panes and Pages
The XWAVE waveform viewer window supports multi-tab pages. By clicking the “+” tab, a new page can be created.
On each page, users can display waveforms using multiple panes. The panes can be moved, deleted, merged, or split all by using the mouse actions. For instance, select one pane by clicking the name field and then click the right mouse button. A pop-up menu will display asking whether to delete that pane or split it into panes with individual signals. Two panes can be merged together simply by dragging one pane into another.
Zooming and Panning
Just like any other graphical waveform viewers, XWAVE Waveform Viewer provides ways to zoom-in, zoom-out, and pan easily. Figure 6 shows the menu icons used for zooming and panning.
The first icon in the second section of the toolbar (the one with a house) is for ‘Zoom to Fit’. In other words, pressing that button will scale the time and value axes of the signals so that the entire waveforms can be fit into the current window.
The next three icons control the response of the mouse click actions on the waveforms. For instance, when the “Zoom Area” button is selected (the one with a magnifier), users can select a rectangular area on the waveform pane to zoom in. On the other hand, when the “Panning” button is selected, users can move the waveforms in any directions without altering the scales of the time and value axes.
Note that the ruler bar located on the bottom acts as another waveform pane on which the users can zoom or pan along the time-axis only.
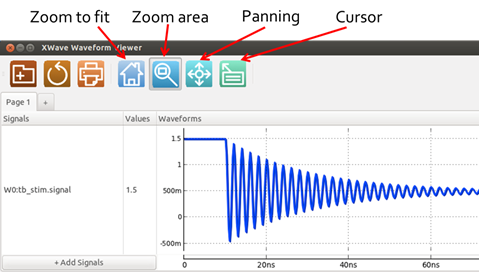
Figure 6. Menu icons for zooming and panning.
Using Cursors
When the cursor icon is selected (the right-most button on the toolbar), users can measure the values of the signals at the desired time location. Simply clicking on the waveform will place the cursor line and update the values located on the left-hand side of the waveforms.
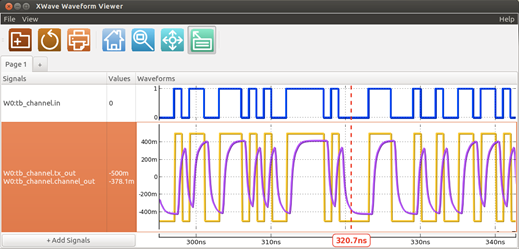
Figure 7. Using cursors to measure signal values.
Showing Event Markers
XMODEL offers powerful ways to simulate accurate analog waveforms on an event-driven simulator like SystemVerilog using its unique, function-based signal representation. Simply put, the computation is performed far less frequently than in any other analog-type simulators. To view the time points at which the actual computation was performed (in other words, the time points of the “events”), the XWAVE Waveform Viewer provides a way to display the event markers on the signal waveforms.
These so-called event markers can be displayed by pressing ‘M’ key or selecting View->Toggle Markers menu. Figure 8 shows the example of displaying the event markers on the signal that has propagated through a lossy channel.
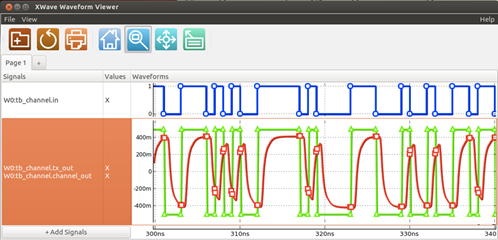
Figure 8. Showing event markers on the waveforms.
Printing and Saving as Image
You can print the waveform and analysis pages or save them into image files (e.g. PNG format). For instance, the File menu provides sub-menus such as Print and Page Setup that let you print all the pages and their panes to a printer or file (e.g. in PDF format), or adjust the printer settings, respectively.
The File->Save as Image menu lets you save the pages into an image file. Figure 9 shows the pop-up dialog when you select this menu. You can select whether to save the visible area only or all panes, and whether to save the current page only or all pages. When saving multiple pages, you can define the naming convention as well. For instance, the default filename is xwave_%pagename%.png. The field %pagename% will be replaced by the name of each page being saved. Note that during this replacement, the whitespaces in the page names will be replaced with underscores “_”.
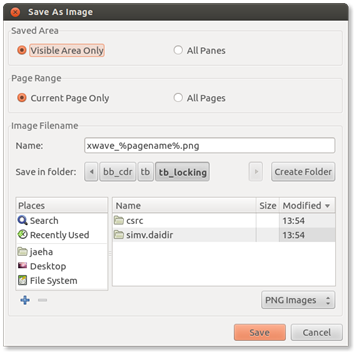
Figure 9. Showing event markers on the waveforms.
Saving and Loading Command Files
Sometimes, one may wish to save the current configuration of the waveforms in multiple panes and pages and restore it later, without having to load the waveforms manually again.
XWAVE Waveform Viewer provides a programmatic way for users to save the configuration and restore it. That is, XWAVE can generate a command file, which is a Python script, that can re-create the current configuration in the waveform viewer. To save a new command file, select the File->Save Command File menu. A file selection dialog will pop-up then.
Users can restore the previous configuration simply executing the command file. The command file can be loaded either by using the -c or --command option at the command-line or selecting the File->Load Command File menu on the GUI window.
Users can write their own command files using the XWAVE API commands. The list of supported XWAVE API commands will be available soon.